Microstructure Transformation of Nanocrystalline Ni3Al During Low Temperature Annealing
Nanocrystals were prepared on the surface of intermetallic compound Ni3Al using strong deformation technology and subjected to low-temperature annealing treatment. The phase structure, grain morphology, and microhardness distribution of the surface layer of Ni3Al in variable morphology and annealed state were studied using X-ray diffraction, transmission electron microscopy, and microhardness tester. The results show that when annealed at 350 ℃ at low temperature, the fcc disordered Ni solid solution formed during strong deformation reordered and partially transformed into the L12 ordered Ni3Al phase. After annealing, the grain size of nanocrystalline Ni3Al did not significantly grow, and the microstrain significantly decreased. After annealing, the microstructure of the surface nanocrystals is uneven, with fine grain sizes of 10-20 nm and large grain sizes still less than 100 nm. After annealing at 350 ℃, the microhardness of the surface layer can still reach 525 HV0.2, and the strengthening effect of strong deformation can still be maintained after low-temperature annealing.
Nanocrystals have a small grain size, a large volume ratio of grain boundary phases, and the grain boundary is in a high-energy nonequilibrium state. Therefore, nanocrystals are thermally unstable and tend to grow at low temperatures. Due to the fact that nanocrystalline materials may face varying degrees of high and low temperature environments under service conditions, and changes in ambient temperature will lead to significant changes in the structure and properties of nanocrystalline materials, it is important to study the thermal stability of nanocrystalline materials, especially intermetallic compound nanocrystals, for understanding the grain growth behavior of nanocrystallines. The previous research in this topic focused on the evolution of microstructure and properties of intermetallic compound Ni3Al under strong plastic deformation conditions [12-13]. In this paper, the microstructure transformation of nanocrystals on the surface of intermetallic compound Ni3Al during low-temperature annealing was studied.
1. Test materials and methods
In this paper, Ni3Al intermetallic compound with chemical composition of 75.9Ni-24.0Al-0.1B (at%) was used as the research object. The preparation process of the alloy is vacuum melting and casting, and after holding at 1200 ℃ for 8 hours, it is cooled in the furnace for homogenization annealing treatment. Finally, the average grain size is about 200 μ M as the initial sample.
Subsequently, a nano layer was prepared on the surface of Ni3Al using a surface mechanical grinding process. The working principle of surface mechanical grinding treatment has been introduced in literature [14]. The surface mechanical grinding process used in this article is: φ 8 mm steel ball, vibration frequency 50 Hz, vacuum degree 10-2 MPa, processing time 90 minutes.
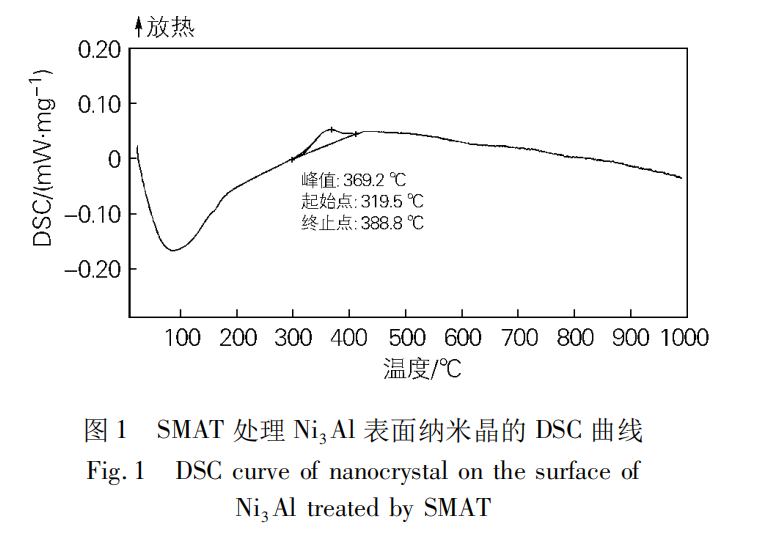
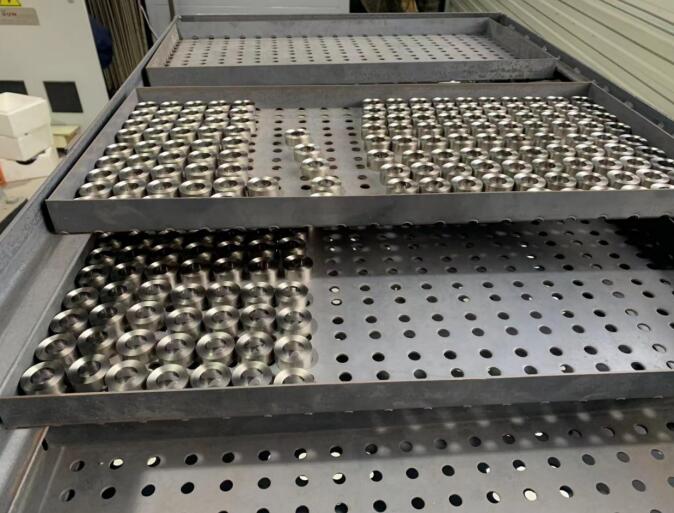
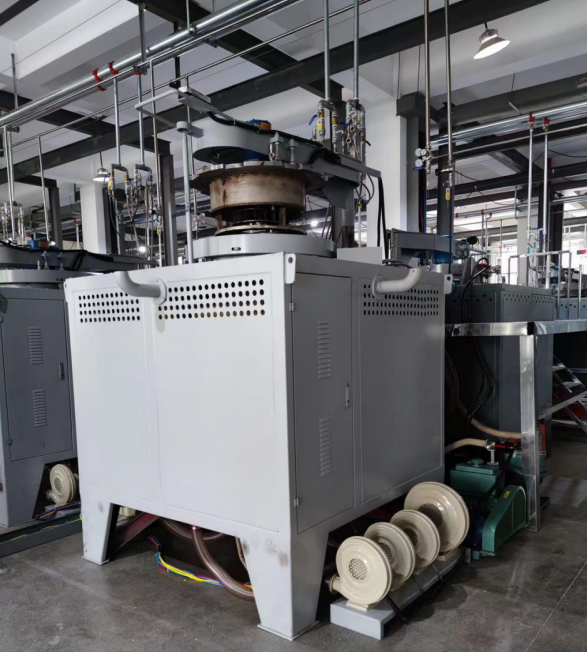
Finally, the surface nanocrystalline sample is subjected to low-temperature annealing treatment. In order to determine the appropriate annealing process, differential scanning calorimetry (DSC) analysis was performed. In the DSC test, the heating speed is 20 ℃/min, and the test temperature range is from room temperature to 1000 ℃. Argon is used as the protective gas. According to the results of DSC analysis, the annealing process for surface nanocrystals was determined. Annealing tests were conducted in a heat treatment furnace manufactured by RQ FURNACE. In order to prevent oxidation due to the high activity of nanocrystals during annealing, surface nanocrystalline samples are packaged in quartz tubes and vacuumed for protection.
In order to observe the evolution of surface layer phase structure and grain structure of surface nanocrystals before and after annealing treatment, X-ray diffraction analysis was conducted. The XRD test was conducted on a Rigaku PRINT 2200/PC X-ray diffractometer using a Cu target with a tube pressure of 40 kV and a tube flow of 40 mA. The scanning step speed is 0.02 °. Based on the broadening of the X-ray diffraction spectrum, the Scherre Wilson equation FW (S) is used × cos θ = K × λ d + 4 × σ × sin θ The grain size, microstrain, and lattice constant of the Ni3Al phase of the surface layer were calculated. Where FW (S) is the width of the diffraction peak of the sample; λ Is the X-ray wavelength, and K is the shape factor of the lattice constant; D is the grain size; σ Is microscopic strain. The calculation was performed using the general X-ray analysis software MaterialsData JADE 5.0. The grain morphology of the surface layer structure after annealing was observed using a JEOL JEM-200CX transmission electron microscope. The samples used for transmission electron microscope observation were all cut parallel to the surface mechanically ground and processed using standard wire cutting, mechanical thinning, and ion thinning procedures. In order to observe the structural transformation of the topmost nanocrystals, the above preparation processes are unidirectional thinning.
To demonstrate the effect of annealing on the microhardness of the surface layer, a microhardness test was conducted on an AKASHI MVK-H21 microhardness tester, with a weight of 200 g and a loading time of 15 s. The test is conducted gradually from the top layer to the substrate, and the sample is polished before the microhardness test.
2. Test results and analysis
2.1 Determination of annealing process
In order to determine the appropriate annealing process, DSC analysis was performed on the nanocrystalline sample on the surface of Ni3Al to obtain the DSC curve shown in Figure 1. From the DSC curve, it can be seen that there is a significant exothermic peak with a peak temperature of about 370 ℃, a starting temperature of about 320 ℃, and a ending temperature of about 389 ℃. The phenomena of surface mechanical grinding and high-energy ball milling Ni3Al in DSC experiments are very similar. A similar exothermic reaction occurred in DSC tests of nanocrystalline Ni3Al prepared by high-energy ball milling and torsional strain [15-16]. In the nano Ni3Al prepared by high energy ball milling, its exothermic peak appears around 337 ℃.
When the milling time is less than 40 hours, the peak temperature decreases with the prolongation of milling time; When the milling time is between 40 and 440 h, the peak temperature increases with the prolongation of milling time. When the milling time exceeds 680 hours, the peak temperature moves towards a lower temperature. Further research shows that for samples milled for 20 to 280 h, this exothermic phenomenon is mainly caused by long-range ordering during annealing, i.e., a transition from a disordered fcc structure solid solution to an ordered L12 structure occurs near this temperature. In the nano Ni3Al prepared by torsional strain, this transition reached the maximum rate of energy release at 345 ℃. It is inferred that Ni3Al subjected to surface mechanical grinding treatment undergoes long-range ordering between 310 and 400 ℃. Therefore, it is determined that the low-temperature annealing temperature is 350 ℃ and the holding time is 30 minutes. The main reason for the difference in long-range ordering temperatures between surface mechanical grinding and high-energy ball milling of Ni3Al nanocrystals may be due to the different grain sizes of nanocrystals. After 90 minutes of surface mechanical grinding, the nanocrystals are about 30 nm, while after high-energy ball milling, the nanocrystals are about 25 nm [16].
2.2 Phase structure changes of nanocrystalline surface layer during annealing
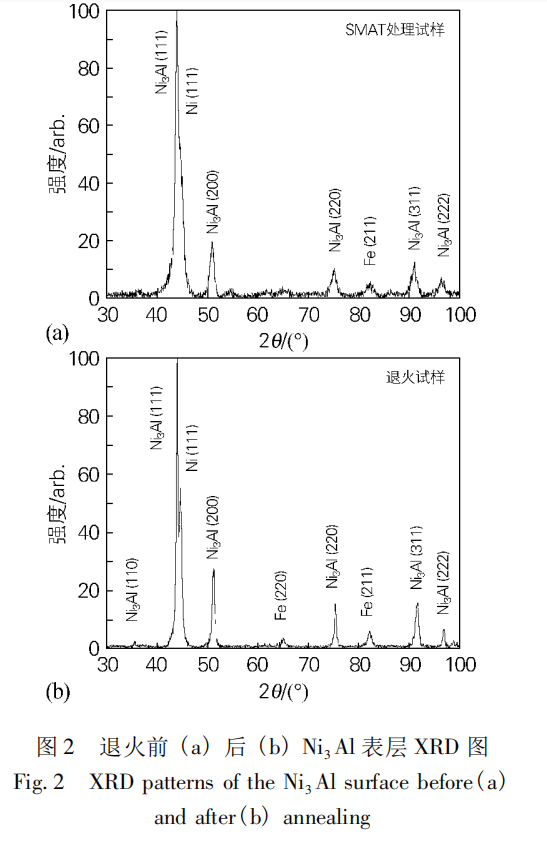
After 90 min of strong plastic deformation by SMAT, the material surface forms a thickness of 15 to 37 μ M deformation layer [13]. The X-ray diffraction patterns of Ni3Al surface structure before and after annealing are shown in Figure 2. The XRD results show that the superlattice diffraction on the surface layer of Ni3Al completely disappears when the morphology changes, and the structure is in a disordered state, i.e., the Ni3Al phase with an L12 ordered structure is transformed into a Ni solid solution with an disordered fcc structure. After annealing at 350 ℃, the diffraction peaks of the Ni solid solution phase and the Ni 3Al phase (111) crystal surface are clearly separated. The relative content of each phase is calculated based on the area of the diffraction peak of each phase, and the results are shown in Table 1.
As can be seen from Figure 2, superlattice diffraction on the Ni3Al (110) crystal surface reappears when annealed at 350 ℃. This indicates that the disordered Ni solid solution phase undergoes a long-range ordering, i.e., a transition to an ordered Ni3Al phase. The calculation results in Table 1 also show that the content of Ni solid solution during annealing decreases significantly compared to the variable morphology. This also indicates that during the annealing process, the Ni solid solution transforms again into a Ni3Al ordered structure. The reordering phenomenon of disordered alloys during annealing also exists in nanocrystalline Ni3Al prepared by torsional strain. The research by Korznikov et al. [16] showed that nano-Ni3Al with a grain size of 20 nm began to undergo long-range ordering when annealed at 317 ℃, and the long-range ordering degree slowly increased with temperature increasing. When annealed at 1040 ℃, the ordering degree significantly increased to 1.2, which is consistent with the experimental results in this paper.
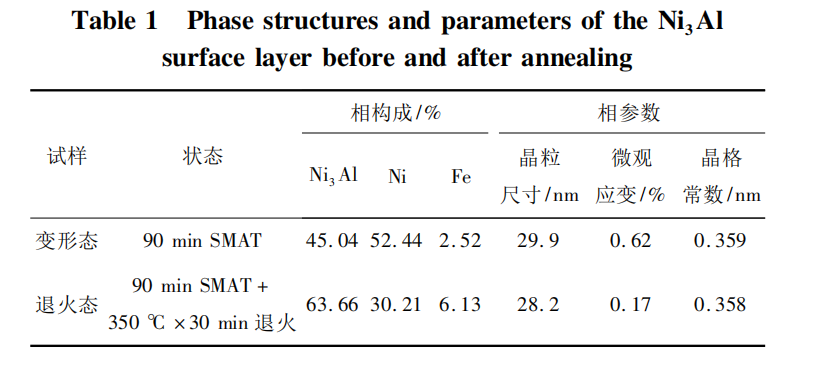
In addition, the structural parameters of the Ni3Al phase calculated from the diffraction peaks of the crystal planes of the Ni3Al phases (200), (220), (311), and (222) are also listed in Table 1. The calculation shows that when annealed at 350 ℃, the grain size of nanocrystalline Ni3Al does not significantly grow, and the lattice constant is also consistent with that in the deformed state. However, the microstrain decreases significantly.
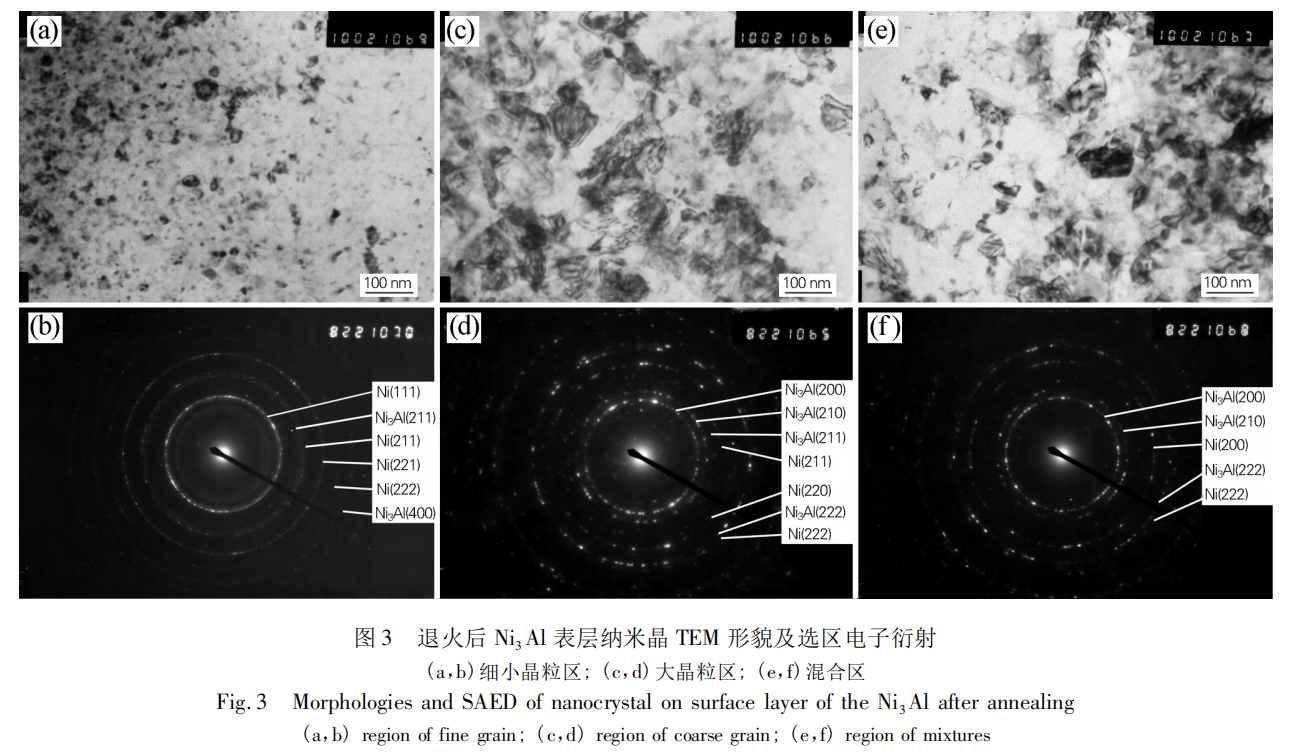
2.3 Structural Characteristics of Annealed Ni3Al Nanocrystals
The TEM image of the outermost layer of the annealed Ni3Al sample is shown in Figure 3. From Figure 3, it can be seen that the grain structure of the nanocrystals on the surface layer of the annealed sample is also uneven, consistent with the non-uniformity of the grain structure during morphology change. The SAED in the fine grain region presents a complete and uniform ring shape, indicating that the grains are still at the nanoscale (Figure 3 (b)). The bright field image shows a grain size of 10-20 nm (Figure 3 (a)). The SAED in the large grain region is still annular, but there are many obvious spots on the diffraction ring. The uniformity of the diffraction ring is lower than that in the small grain region, and the grain size is still less than 100 nm (Figure 3 (c, d)). In the region where two sizes of grains coexist, SAED has a mixing characteristic of both. In addition, the alternating contrast changes in the bright field images of the grains indicate that dislocations formed during deformation still exist within the nanocrystals. From the SAED of the fine grain region, it can be seen that superlattice diffraction occurs on the Ni3Al (211) crystal surface. Superlattice diffraction of Ni3Al (210) and (211) crystal surfaces occurred in the large grain region. In the mixing region, superlattice diffraction on the Ni3Al (211) crystal surface also still exists. This indicates that when annealed at 350 ℃, the disordered Ni solid solution phase has begun to undergo an ordered transformation. This result is consistent with the results of DSC and XRD tests. The ball milled completely disordered Ni3Al powder begins to undergo long-range ordering when annealed at 200 ℃, which is lower than 350 ℃ in this article. The reason for this difference may be the high-density grain boundaries generated during intense plastic deformation. High density grain boundaries have the effect of hindering the long-range ordering process. Clark et al. [18]’s research on the recovery and ordering process of Ni3Al shows that the recovery of long-range ordering and grain size depends on the mobility of vacancies within this temperature range. Therefore, the long-range ordering of disordered alloys during annealing may be related to the enhancement of atomic activity due to crystal defects. During annealing, crystal defects caused by strong plastic deformation become unstable and are eliminated at a certain temperature. The release and elimination of corresponding vacancies can provide a driving force for atomic motion for long-range ordering.
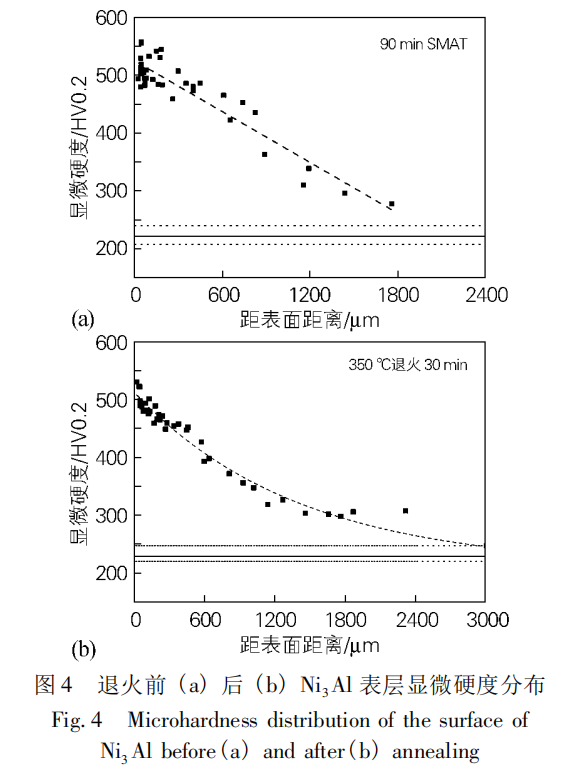
2.4 Microhardness of Ni3Al surface layer after annealing
The distribution of microhardness of Ni3Al surface layer before and after annealing is shown in Figure 4. The matrix hardness is indicated by three horizontal lines, the solid line in the center is the average value of the 7-point test results, and the upper and lower dashed lines are the maximum and minimum values of the matrix hardness, respectively. The distribution of surface microhardness is shown in the form of a scatter diagram, with the points in the diagram being the actual test points for microhardness. As can be seen from Figure 4, after low-temperature annealing at 350 ℃, the microhardness of the substrate has little change, basically around 225 HV0.2. The microhardness of the surface layer can reach 525 HV0.2. This indicates that the strengthening effect of strong plastic deformation can still be maintained after annealing at 350 ℃. This is related to the strengthening effect caused by the long-range ordering transformation of disordered phases. The microhardness changes of nanocrystalline Ni3Al prepared by high pressure torsional strain during annealing also showed a similar trend [16].
3.Conclusion
1) After 90 minutes of surface mechanical grinding, the Ni3Al sample undergoes long-range ordering when annealed between 310 and 400 ℃.
2) When annealed at 350 ℃, the partially disordered Ni solid solution phase transforms into an ordered Ni3Al phase. The grain size of the Ni3Al phase remains about 28 nm, and there is no significant growth compared to the variable morphology. However, the microstrain in the annealed state decreases significantly.
3) After annealing, the microstructure of the surface layer is uneven. The grain size of the fine crystal region is 10-20 nm, while the grain size of the large crystal region is still at the nanometer level. Alternate contrast changes caused by dislocation can be observed inside the nanocrystals.
4) The strengthening effect produced by strong plastic deformation can still be maintained after annealing at 350 ℃. After low-temperature annealing at 350 ℃, the microhardness of the surface layer can still reach 525 HV0.2.
Oxygen Probe In Gas Cementation Furnace Automotive Crankshaft Nitriding Technology Process Effect Of Magnetic Field Annealing On Structure And Properties Of Soft Magnetic Materials
Contact us
Your email address will not be published. Required fields are marked *